How to make a figure for a scientific paper
A good figure communicates your result at a glance — and it's often what decides whether the reader understands the study. You don't need Illustrator or a designer: describe what you want to show and get a publication-ready figure in the journal's format.
The figure types a paper needs
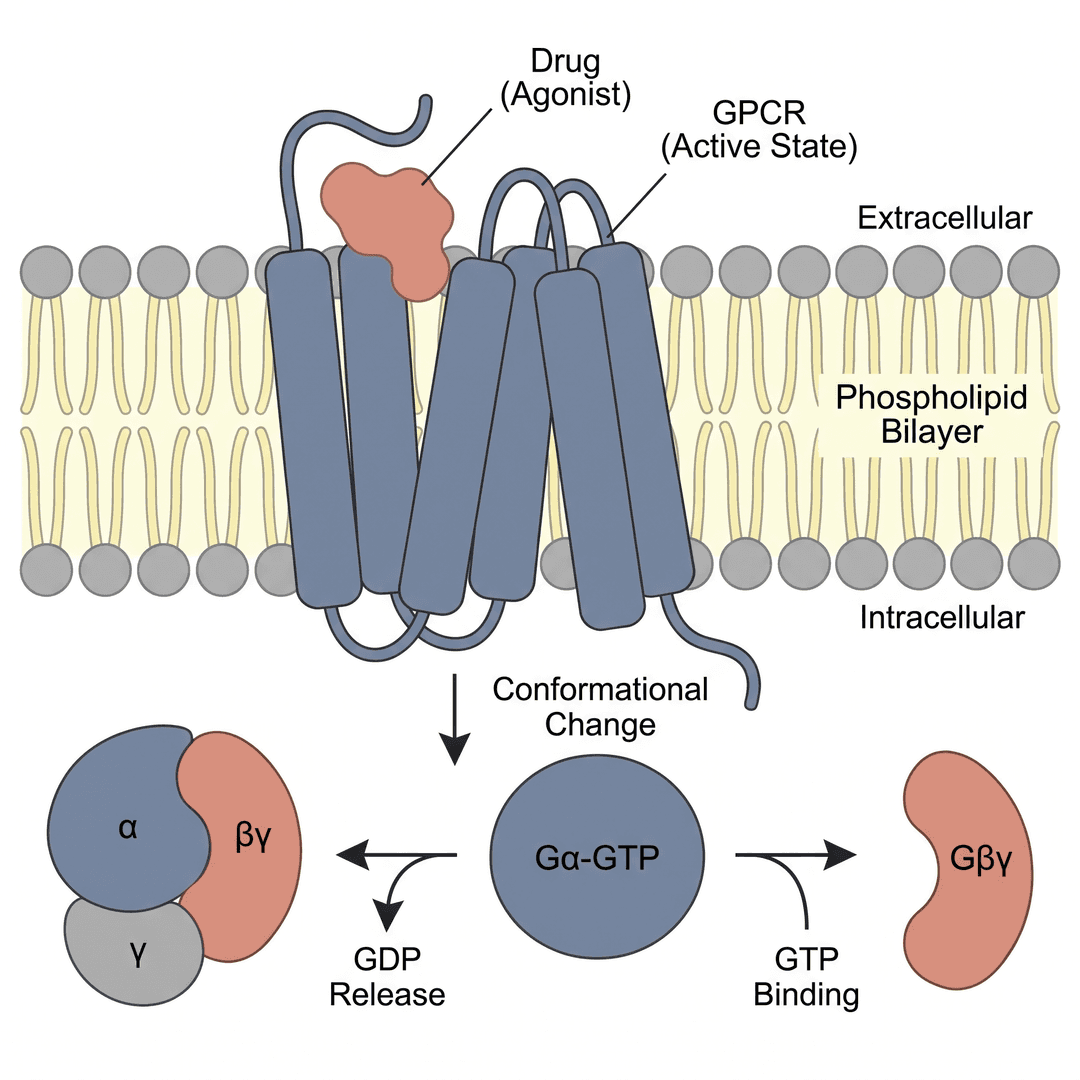
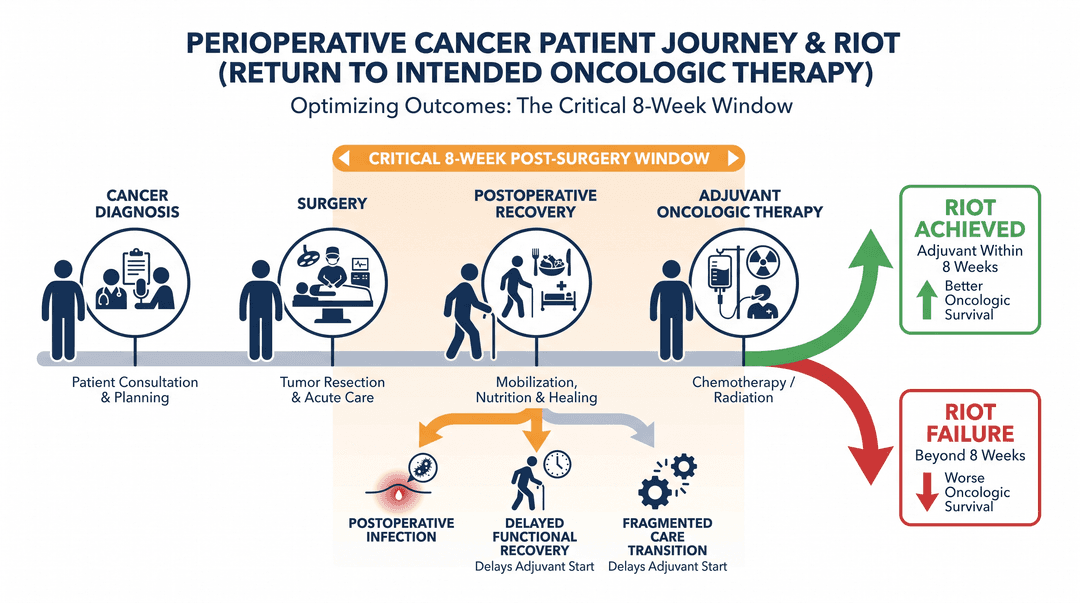
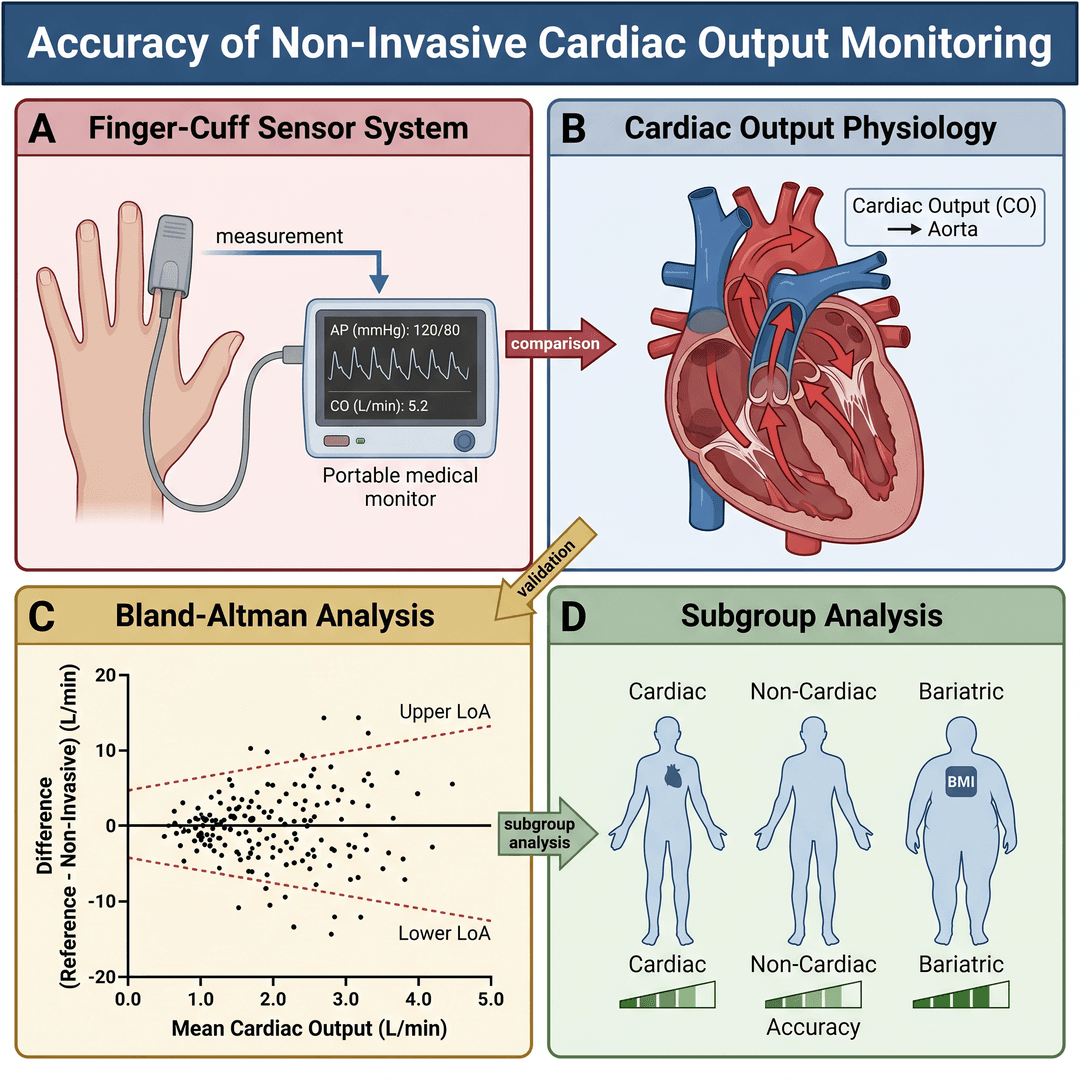
Graphical abstract (visual summary of the study), mechanism diagram (molecular or physiological pathway), flowchart or decision algorithm, and anatomical/schematic illustration. Each type has its own structure — the trick is choosing the right format for the message, not cramming everything into one figure.
What makes a figure publication-ready
Clean vector linework (nothing pixelated), short legible labels, a restrained palette with one accent on the key point, clear visual hierarchy, and a white background. Beyond the design, the file matters: journals require high resolution (300 DPI), formats like TIFF or PDF, and a width that fits one or two columns.
Why not PowerPoint or loose screenshots
Figures assembled in PowerPoint come out low-resolution, with inconsistent fonts and fragile alignment — a common cause of technical rejection during journal production. A figure built like a paper's 'Figure 1', vector and labeled, passes cleanly and elevates the work.
- 1Pick the path
Describe it in one sentence, drop the paper's PDF for suggestions, or ground it in your data (forest plot, existing figure).
- 2The assistant builds the brief
It structures layout, labels, and palette in paper-figure style. You review it before spending a credit.
- 3Generate and export
Get it in seconds (or 3 variations) and download PNG, TIFF 300 DPI, or PDF at the journal's size.
Create your paper's figure now
Describe what you want to show and get a publication-ready figure in seconds. No subscription — pay only for what you use.
Start a new figure