How to make a central illustration for your paper
The central illustration is the single figure that tells your study's whole story — question, method, and key finding, at a glance. High-impact journals (like JACC and Annals) request one, and it's often what circulates most from your paper. Describe the study and get a ready central illustration.
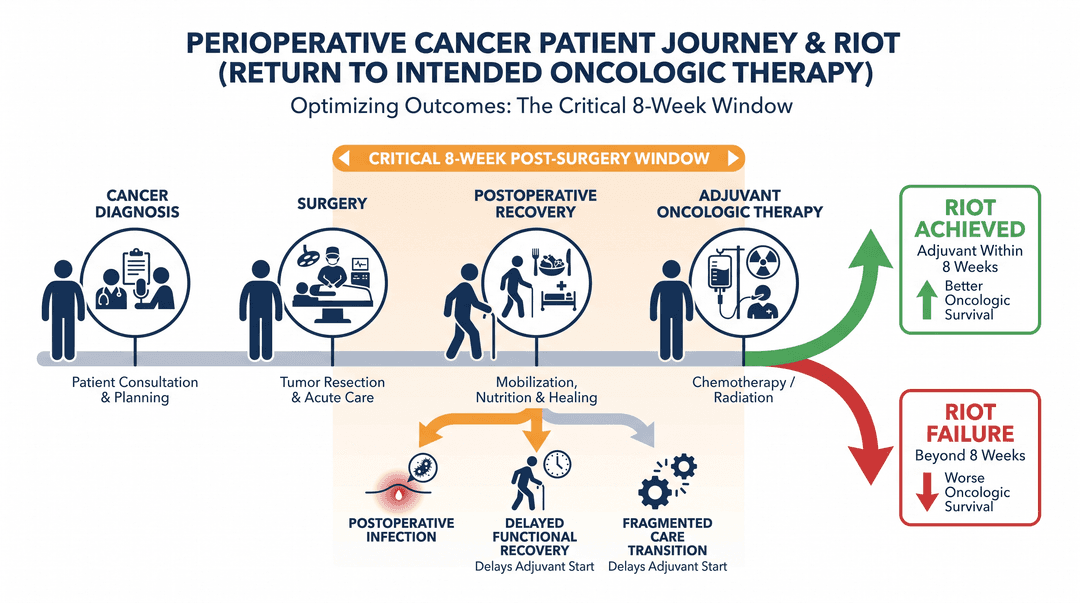
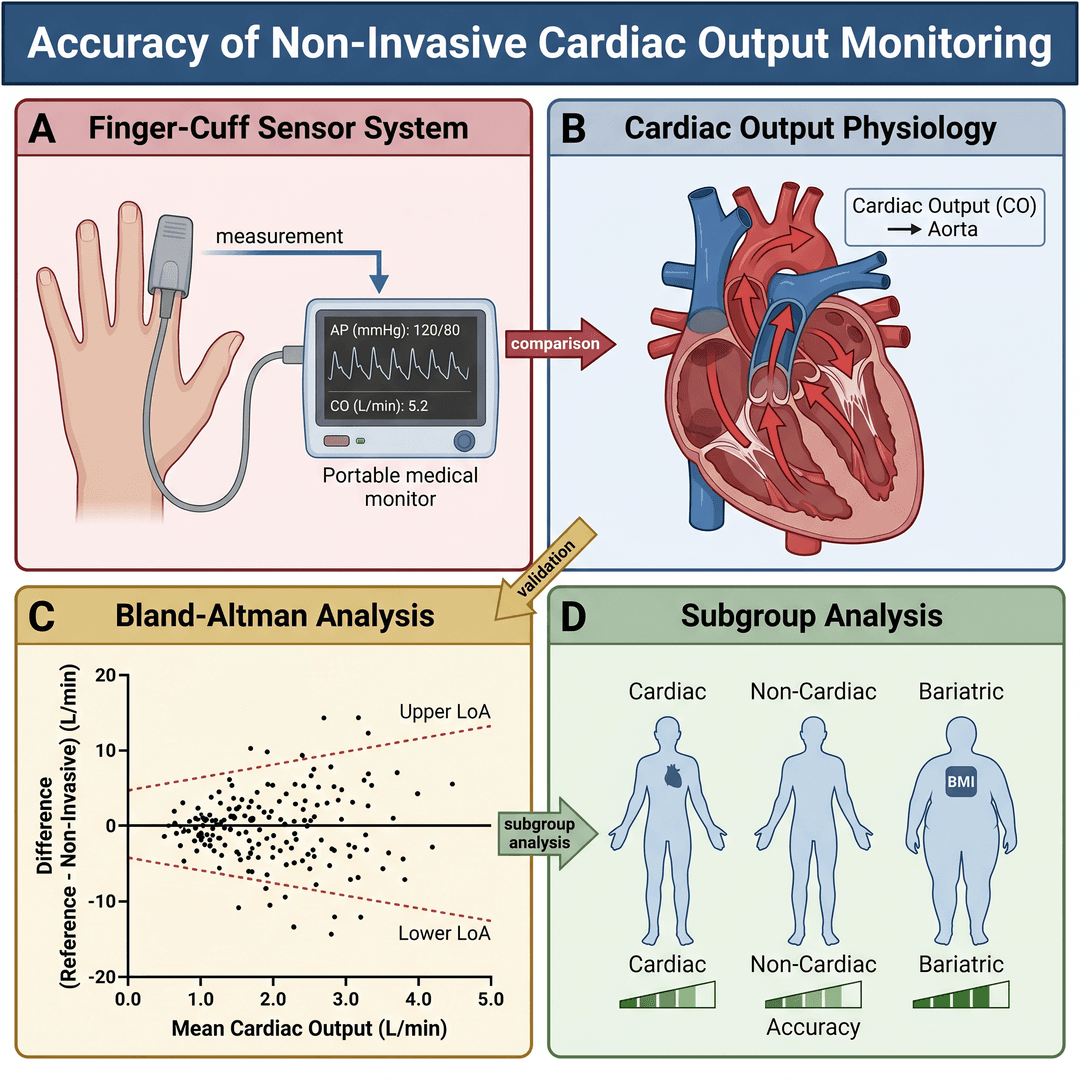
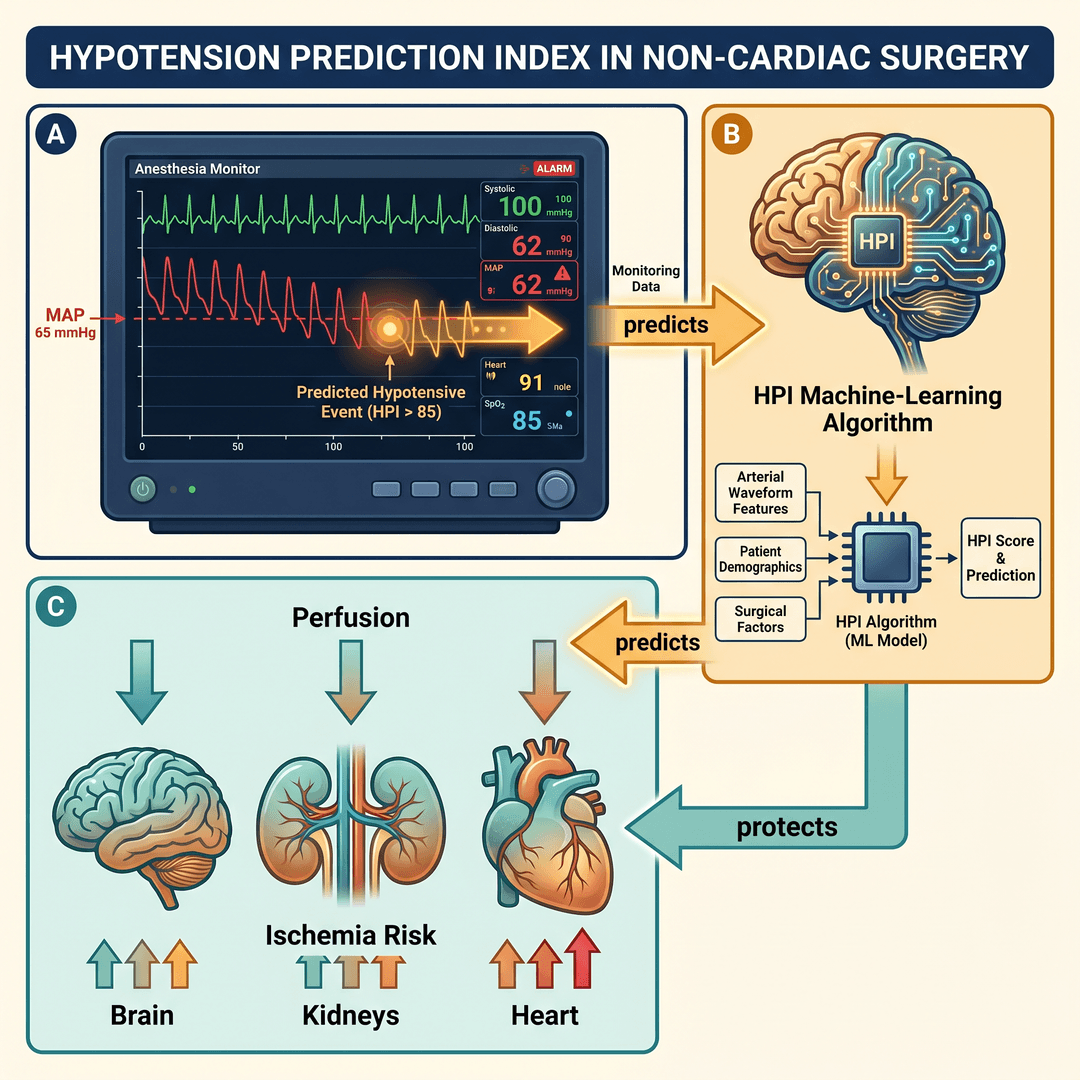
What a central illustration is
It's a fuller visual summary than a graphical abstract: usually organized top to bottom — the question and population at the top, the design/method in the middle, the key finding and practical message at the bottom. It has to stand on its own, without the paper's text.
What makes a good central illustration
A clear vertical narrative (question → method → result → takeaway), a single highlighted finding, real data (effect sizes, CIs) where available, and visual discipline: one palette, consistent typography, no clutter. It's your thesis translated into one image.
Central illustration vs. graphical abstract
A graphical abstract is shorter and horizontal (population → intervention → outcome). The central illustration is richer and vertical, with room for the study design and the final message. Many cardiology and surgery journals prefer the latter — check the author instructions.
- 1Describe the study and finding
e.g. "RCT of regional anesthesia vs. opioids; outcome: opioid consumption; finding: significant reduction".
- 2The assistant builds the narrative
It structures question → method → result in a clean vertical layout, with the key finding highlighted. You review it before spending a credit.
- 3Generate and export
Get it in seconds (or 3 variations) and download PNG, TIFF 300 DPI, or PDF in the journal's format.
Create your central illustration now
Describe the study and get the central illustration that tells the whole paper. No subscription — pay only for what you use.
Start a new figure